Drawing Spirals
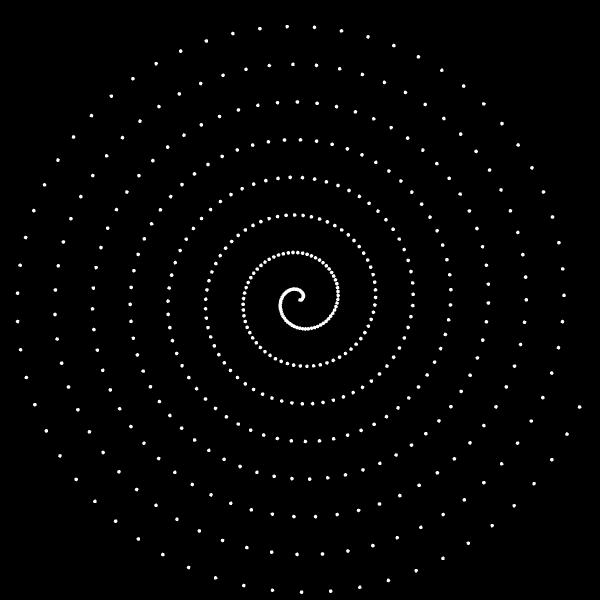
Occassionally I like to draw some art using code. In this case, I wanted to try to draw some spirals. My first attempt draws a dot at the current angle, increments the angle, and increments the radius.
function spiral1(r, a, n, ainc, rinc, color) {
    for (let i = 0; i < n; i++) {
        let x = Math.cos(a) * r + .5
        let y = Math.sin(a) * r + .5
        fill(circle(xy(x, y), 0.003), color)
        a += ainc
        r += rinc
    }
}
spiral1(0, 0, 500, 0.1, 0.001, white)
That was easy. Looks ok, but what if I draw multiple spirals with different colors, and offset the starting angles.
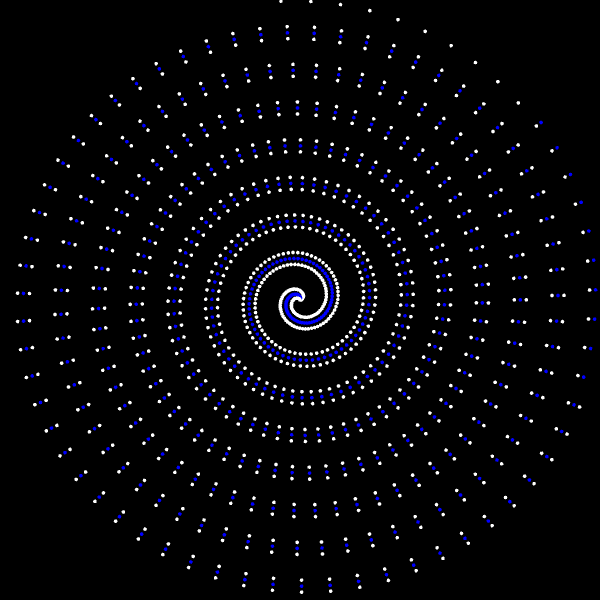
spiral1(0, 0, 500, 0.1, 0.001, white)
spiral1(0, 1, 500, 0.1, 0.001, blue)
spiral1(0, 2, 500, 0.1, 0.001, white)
Interesting. Notice how the spacing between points is tight near the center, but gets fairly distant towards the outside of the spiral.
I was curious, could I make the spacing consistent? It took me a few tries and a day of headscratching to figure out. The angle increment
needs to get smaller as the radius gets larger. So, if I know the distance between the points and the radius, then I can solve for the angle
using the arcsin function. Math.asin() is only valid in the range [-1, 1], which was annoying to work with, so I ended up preferring
Math.asinh() which seemed more tolerant to various inputs.
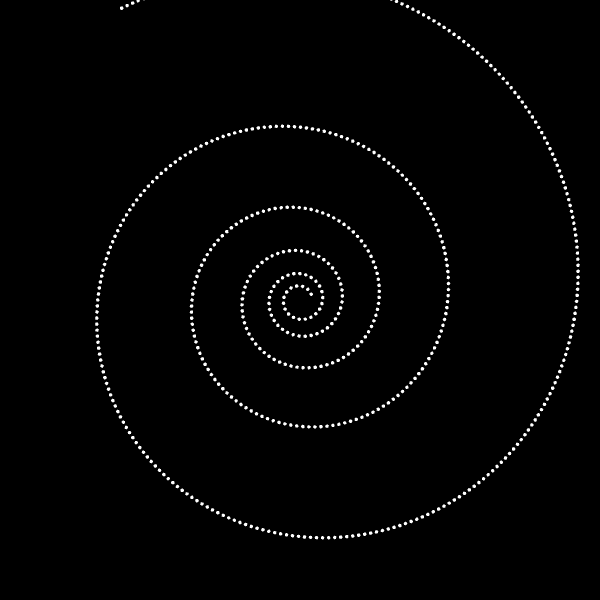
function spiral2() {
    let opp = .01
    let r = .02
    let ang = 0
    let center = xy(.5, .5)

    for (let i = 0; i < 550; i++) {
        let angInc = Math.asinh(opp / r)
        ang += angInc
        r += 0.001

        let p = polar(ang, r).add(center)
        dot(p)
    }
}

spiral2()
Nice! So the points are evenly spaced, but now the radius looks weird; the spiral isn't as dense as I want. That's because the code in incrementing the the radius by a fixed amount, even though I'm drawing more dots in a given angle as the spirals grows. The trick here was to increment the radius at a rate relative to the angle increment.
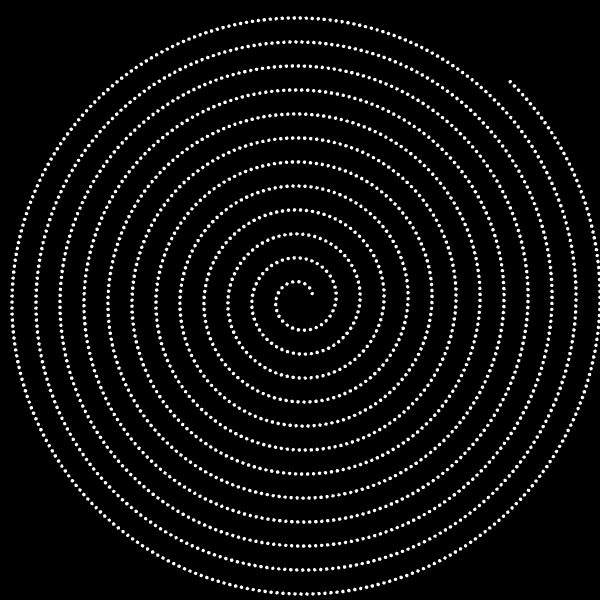
let opp = .01
let r = .02
let ang = 0
let rate = .02 / Math.PI
let center = xy(.5, .5)

for (let i = 0; i < 2000; i++) {
    let angInc = Math.asinh(opp / r)
    ang += angInc
    r += rate * angInc

    let p = polar(ang, r).add(center)
    dot(p)
}
Now it's looking the way I originally imagined! I draw 2000 dots in that example, but I came up with a way to just fill the screen: draw dots until the radius
is larger than the diagonal from the center of the screen to a corner (MAXR = Math.sqrt(.5*.5 + .5*.5)). And, along the way I added all sorts of variation:
squares instead of dots, lines between each point, random sizes, a color scheme, and more.
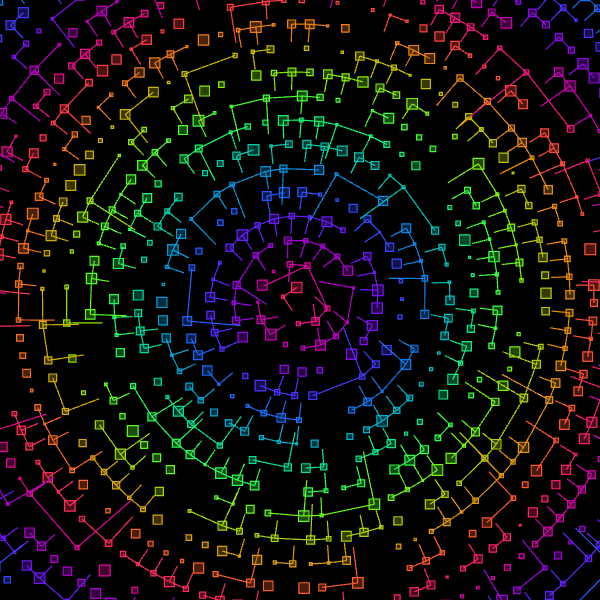
let pal = cos_color_palette(0)
let opp = .03
let r = 0.01
let ang = 0
let rate = .02 / Math.PI

let circleSize = () => rand_range(.003, .018)

let center = xy(.5, .5)
let MAXR = Math.sqrt(.5*.5 + .5*.5)
let prev = center

dot(center, {color: pal(r), size: circleSize})

while (r < MAXR) {

    let angInc = Math.asinh(opp / r)
    r += rate * angInc
    ang += angInc

    if (rand_num() < .2) {
        continue
    }

    let p = polar(ang, r).add(center)

    let color = pal(r * 2)
    if (rand_num() < .5) {
        let l = line(prev, p)
        stroke(l, color)
        stroke(line(p, l.orthogonal().add(p)), color)
    }

    let size = circleSize()
    let sh = Rect.xywh(p.x, p.y, size, size)

    fill(sh, color.alpha(.3))
    stroke(sh, color, {width: .001})
    prev = p
}